The Spectrogram
The Spectrogram is one of the possible track views in Audacity, along with waveform. Most of these screenshots will use Multi-view, which shows both the waveform and the spectrogram for an audio track, one above the other.
The scale on the left goes from low frequencies (100 Hz or less) at the bottom (think bass or thumps) to high frequencies (9000 Hz or higher) (like the squeak of a mouse). The color brightness indicates how much of a certain frequency is present, from black or dark blue (not much) through pink to white/yellow/orange (a lot).
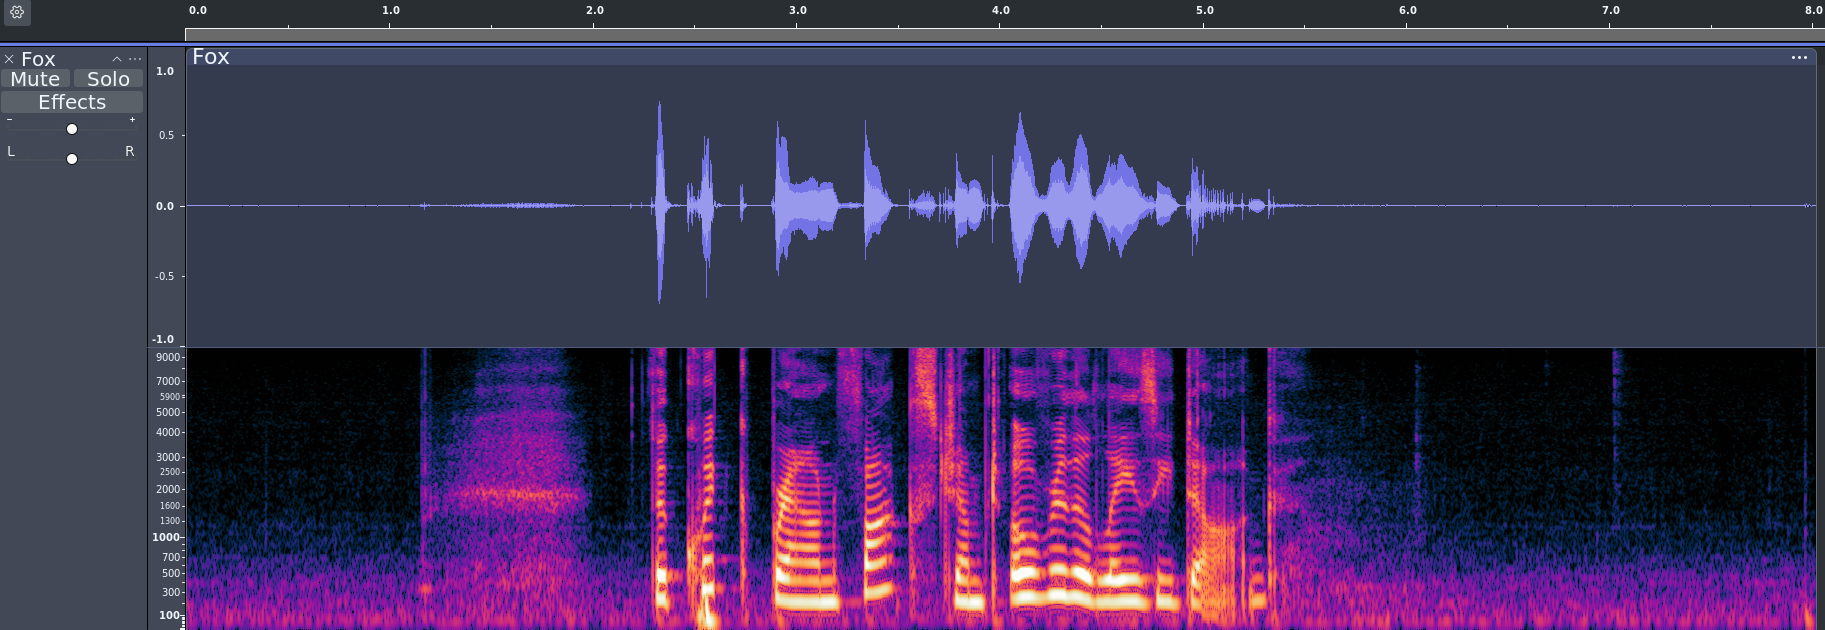
Audio: [ breath ] The quick brown fox jumped over the lazy dog.
The time in seconds is given along the top of the image—0.0 to 8.0. From 0.0 - 1.0 seconds, we have a pretty typical “mostly silent” section–there tends to be more color at the bottom. The somewhat blurry cloud shape between 1.0 - 2.0 seconds is a breath.
Interpreting speech in the spectrogram
Let’s zoom in on just “The quick brown fox” to take a closer look at that section.
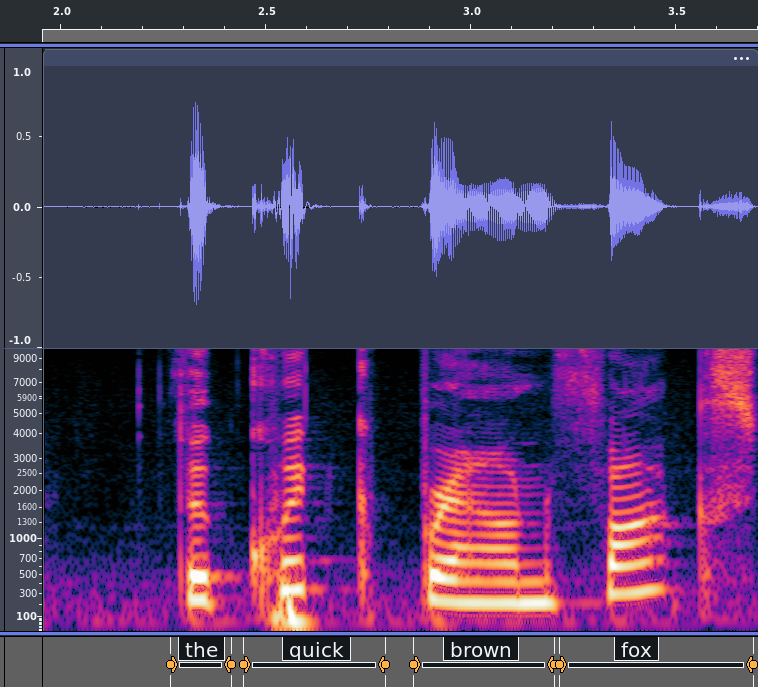
A vowel will show up as bright layers in the 100-3000 frequency range. In this phrase, each word has one vowel group and they have relatively sharp consonants in between, so each word shows up as a distinct colored blob.
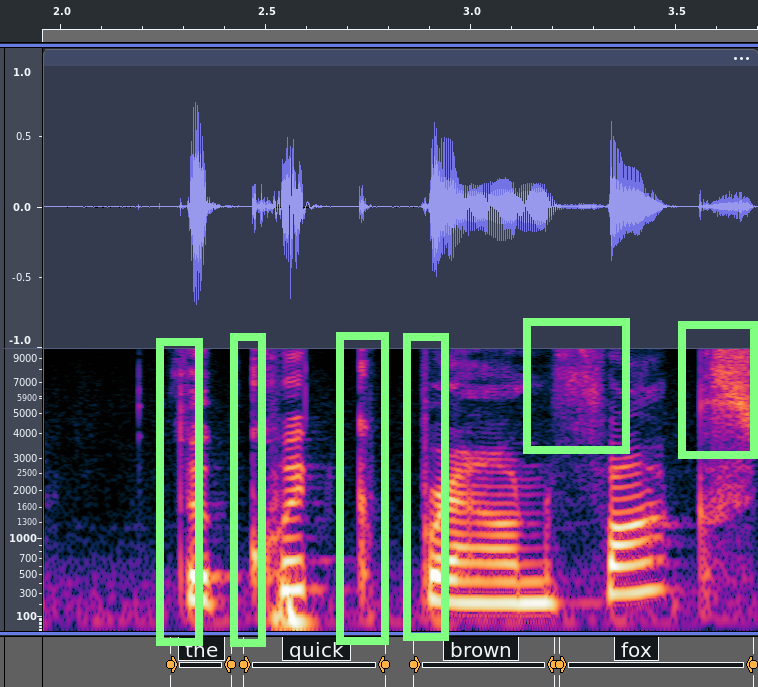
A hard consonant will often show up as a vertical boundary spanning from the lowest frequencies through the highest, where one side is dark and one side is bright. “The,” “quick,” and “brown” each begin abruptly in this way. The final “k” in “quick” shows up as a thin vertical bright line since it also ends abruptly. A little cloud up above 5000 Hz frequency tends to mean an “f” or an “s” (though in this particular example the “s” sound at the end of “fox” goes from about 1600 Hz up).